Turn your data into infographics people share
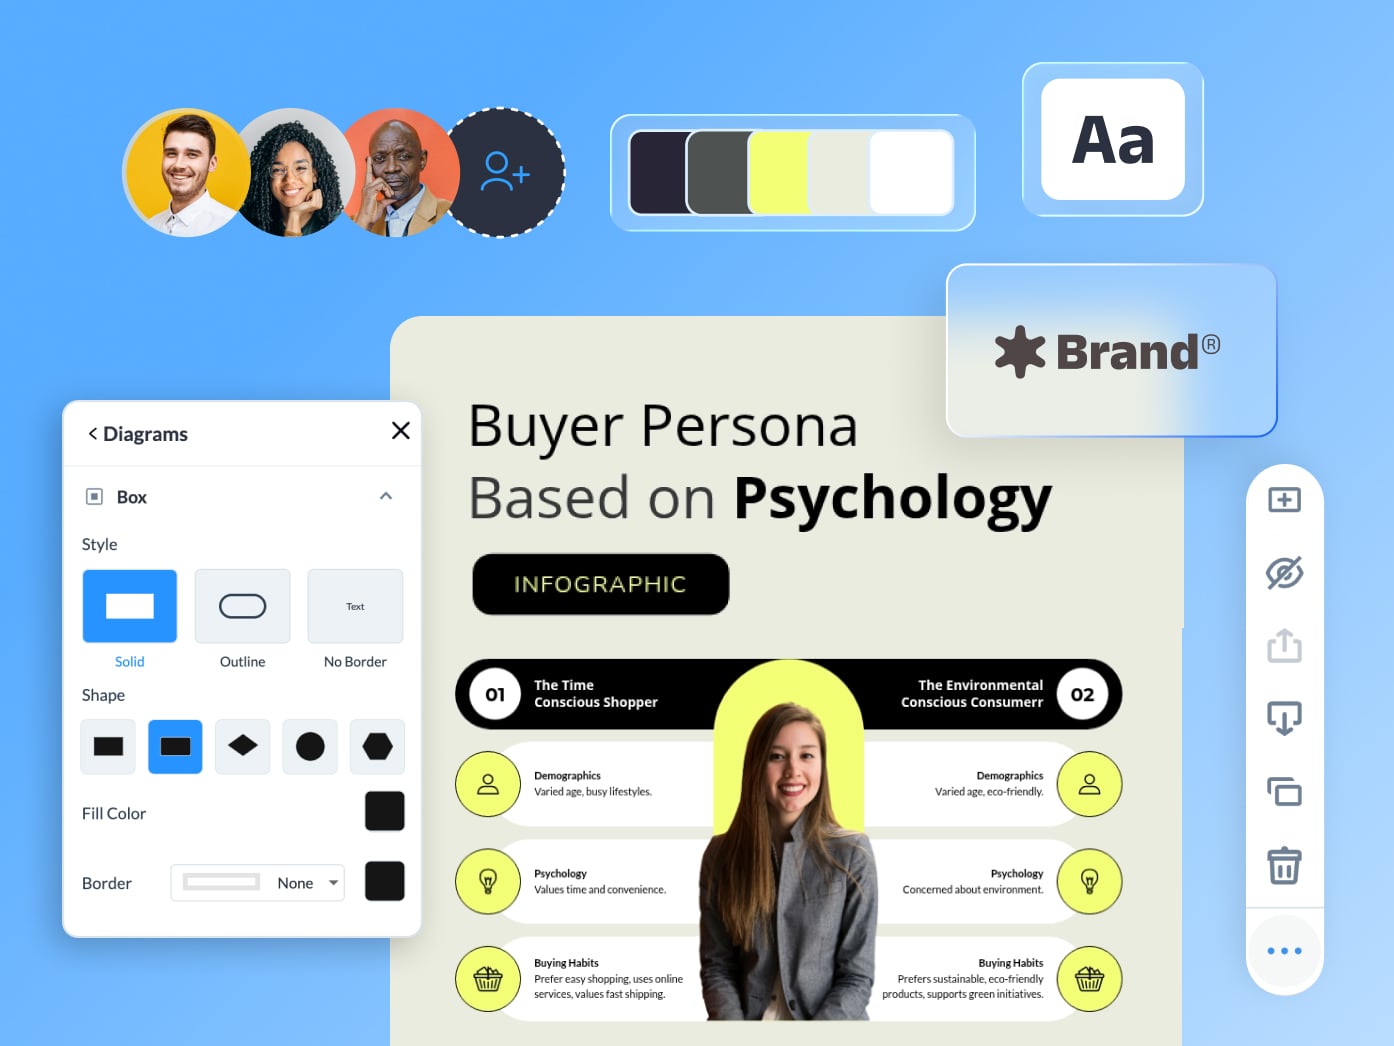
You have the data and the story. Turn it into a branded infographic people actually read and pass on, built from a template in minutes.
- Start from an infographic template built for your topic, not a blank canvas.
- Apply your logo, fonts, and colors in one click with Brand Kit.
- Turn numbers into charts, icons, and data widgets that make the point.

 4.5
4.5
 4.5
4.5
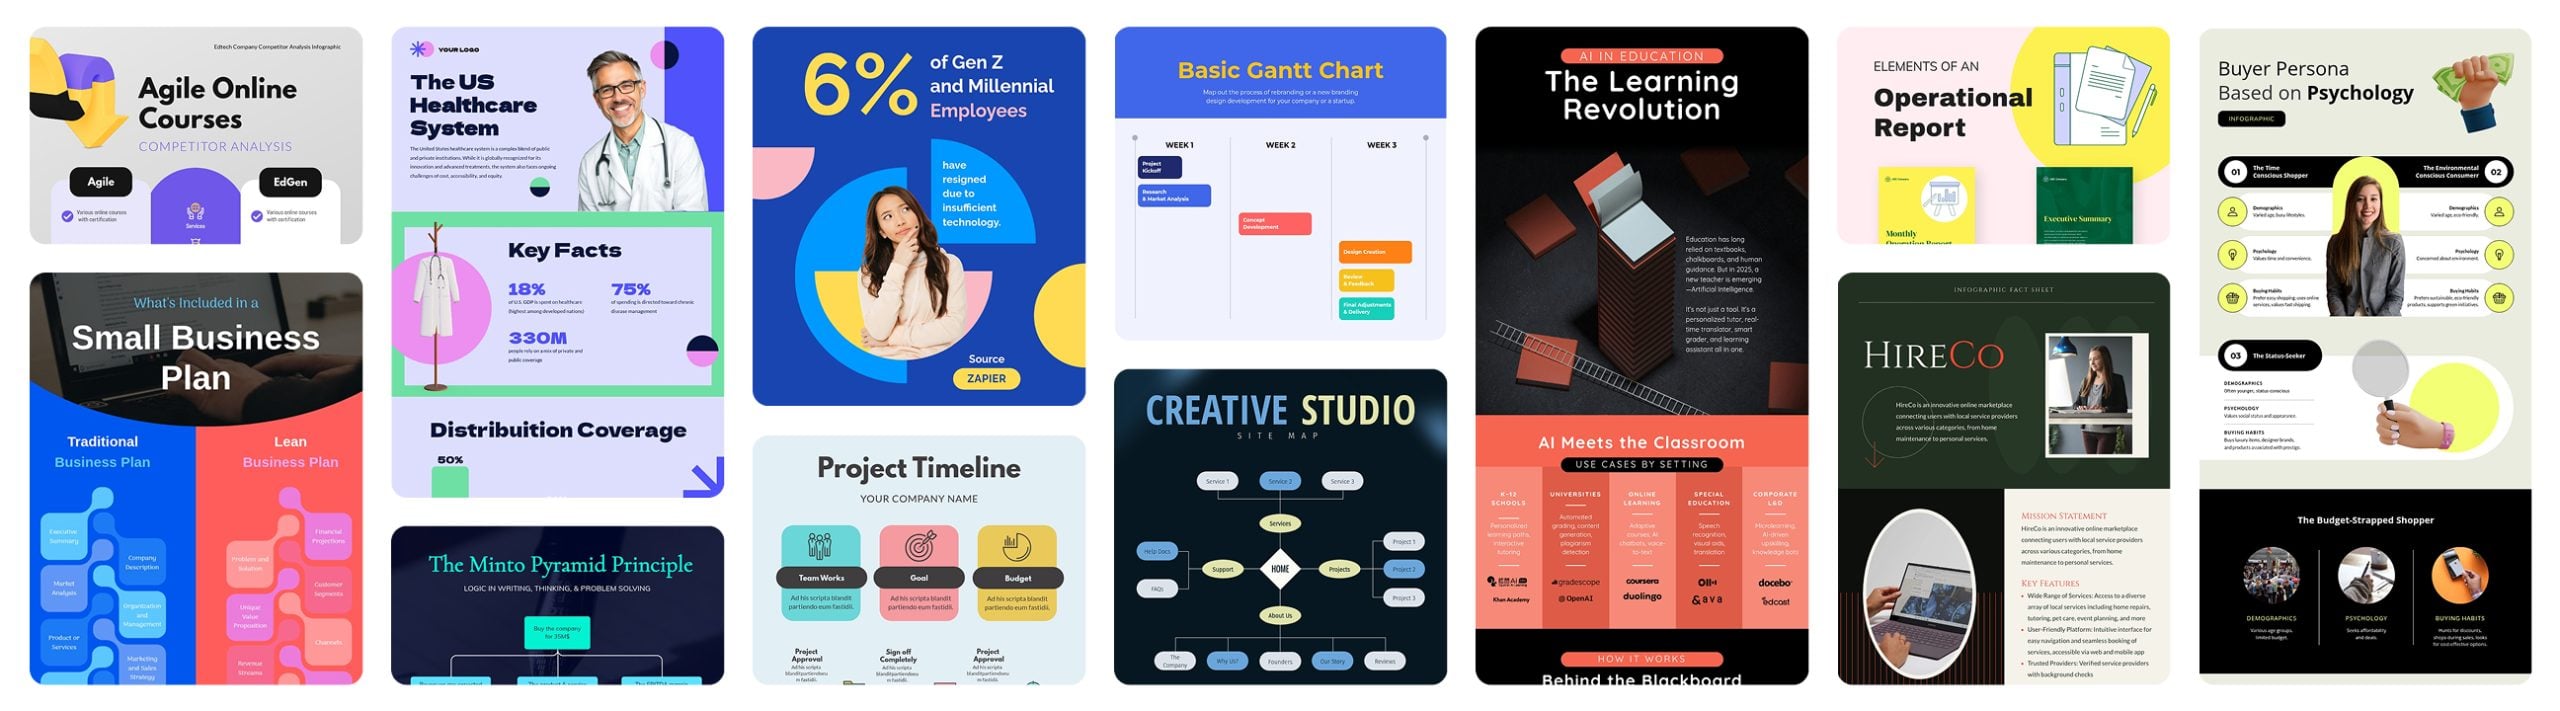
A wall of stats is not an infographic
Every Visme infographic template pairs a strong layout with charts, icons, and data widgets, so the information reads at a glance instead of getting lost in a block of text. Swap in your data, apply your brand, and publish something people share.
AI tools to speed up the work around your designs
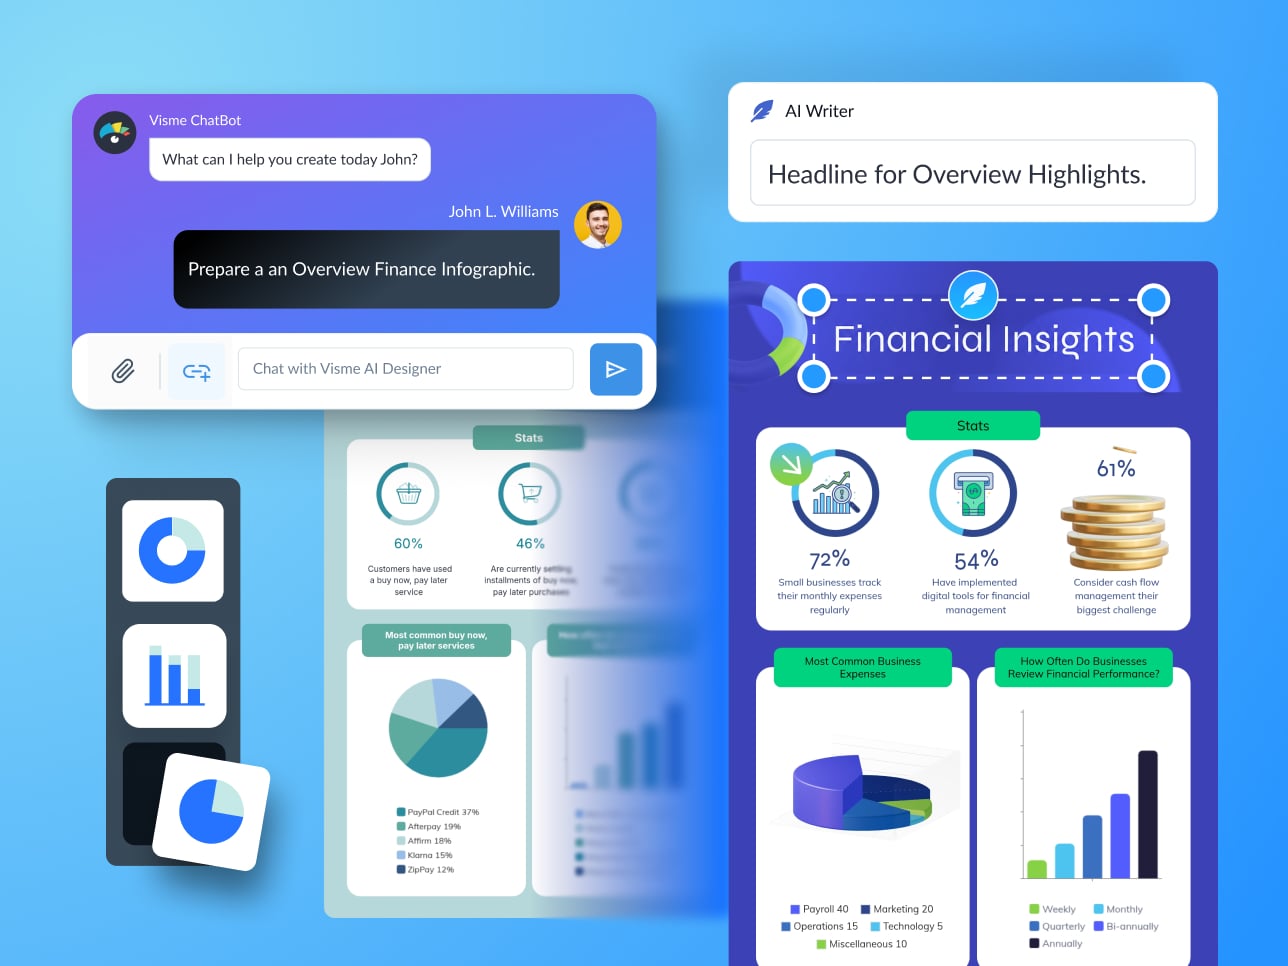
Visme’s AI helps you to fasttrack your design, so you build the infographic faster.
- Write and tighten your headline and labels with AI Writer.
- Create custom icons and images with the AI Image Generator instead of stock.
- Pull your figures into charts and data widgets that update when the data changes.
Stay on-brand and reuse what works
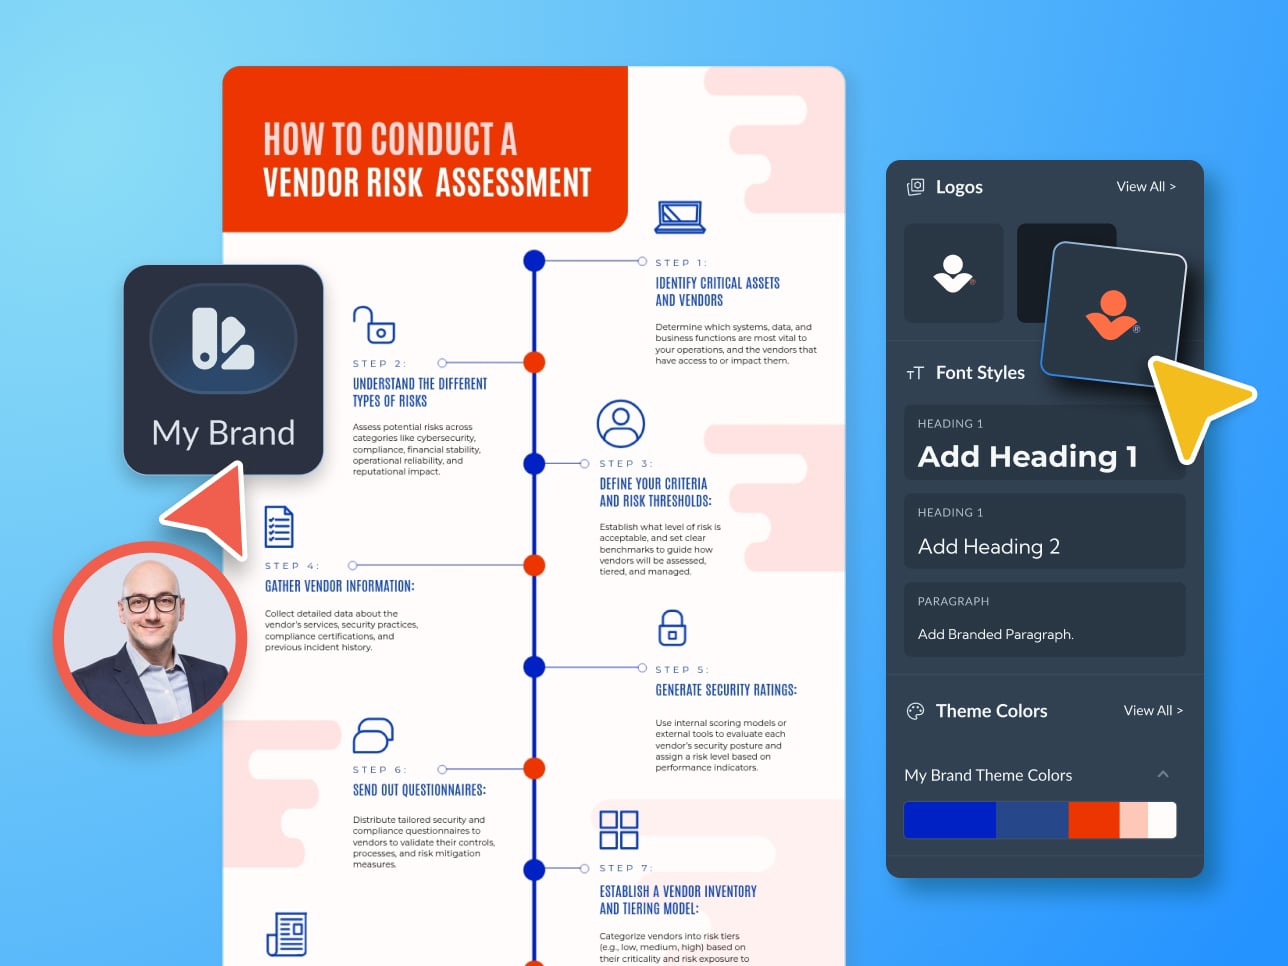
Set your brand once, save the infographics that land, and keep every one consistent.
- Apply your logo, fonts, and colors across every infographic in one click with Brand Kit.
- Save your best infographics as templates the whole team can reuse.
- Swap in fresh data and copy with the drag-and-drop editor, no rebuild.
Publish, share, and see what lands
An infographic is made to travel. Share it where your audience is and see how it performs.
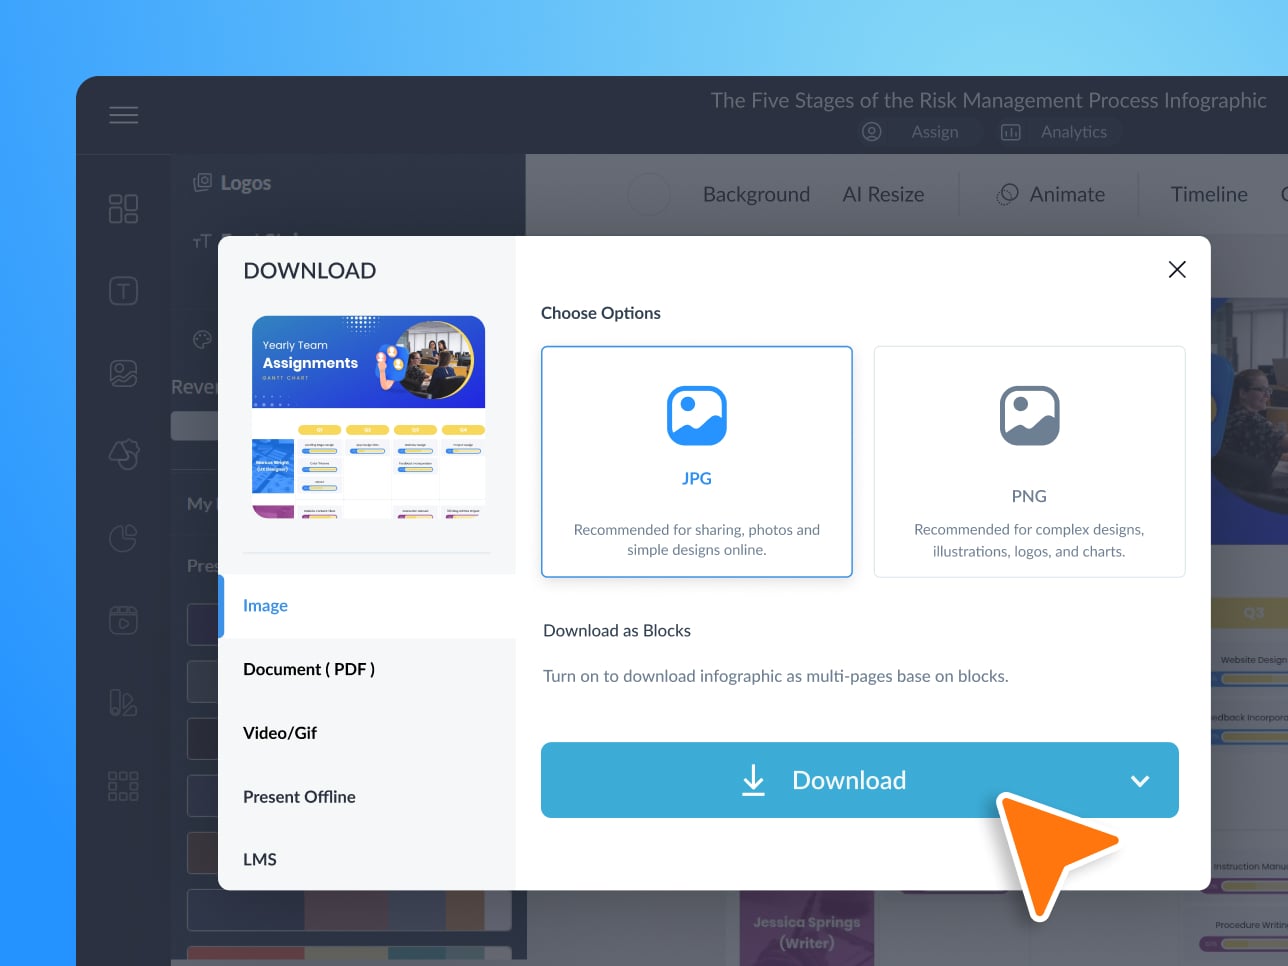
- Download as PNG or PDF, share an interactive link, or embed it on your site.
- Add animation, hotspots, and links to make a static graphic interactive.
- Track views on shared links so you know which infographics land.
Real results from teams
that create with Visme












See The Full Picture Behind Each Result
Turn your data into an infographic worth sharing
Build it, brand it, and publish it in minutes with Visme. From a template to a finished graphic without the design bottleneck.
Frequently Asked Questions
Visme's AI does not build a finished infographic on its own, but it speeds up the work: AI Writer drafts and tightens your copy, and the AI Image Generator creates custom icons and images while you build from a template.
Choose an infographic template, add your data and text, apply your brand with Brand Kit, then download or share a link. Charts and data widgets turn your numbers into visuals as you go.
Visme is where teams create infographics, reports, and other branded content that make information simple to share, without waiting on a designer.
Yes. Save your logo, fonts, and colors in Brand Kit and apply them across every infographic in one click.
Download as PNG or PDF, share an interactive link, or embed it on your site. Interactive links also let you track views.
Yes. You can start making infographics for free and upgrade when you need advanced brand controls, downloads, or team features.